Key Updates on the Economy & Markets – 7/1/2026
Stocks bounced back strong in Q2, with the S&P 500 up 15% and near record highs. The Middle East conflict eased as both sides moved toward a ceasefire, pushing oil prices back down. AI enthusiasm returned, lifting semiconductor stocks, and solid earnings spread the gains beyond tech into smaller companies. One catch: the earlier oil spike pushed inflation to a three-year high, leading the Fed to signal rate hikes instead of cuts. Here’s what happened and what to watch in Q3.
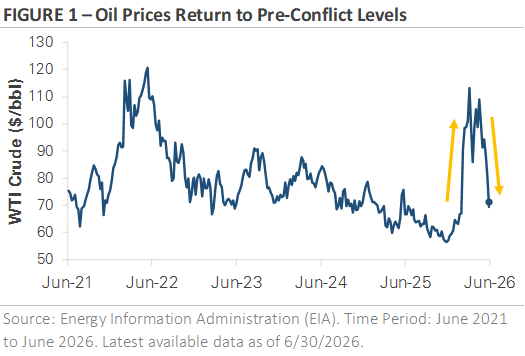
Oil Prices Return to Pre-Conflict Levels
The energy shock came and went quickly. Oil spiked near $115 in early April after the Middle East conflict shut down the Strait of Hormuz — a critical passage carrying nearly 20% of the world’s oil supply. But a U.S.-Iran ceasefire and expectations of the Strait reopening sent prices back down to around $70 by quarter’s end — right where they started. Gas prices followed the same pattern: up sharply in spring, back down by late Q2.
Why Oil Prices Matter for Your Wallet and Interest Rates
Energy prices drive inflation — and inflation drives interest rates. When oil spiked earlier this year, consumer prices jumped 4.2% in May, the highest in three years. More than half of that increase was tied to energy. Strip out energy and inflation was a more modest 2.9%, suggesting this wasn’t a broad price problem — just an oil problem.
That spike flipped the interest rate narrative completely. Markets started the year expecting the Fed to cut rates two or three times. By Q2, they were pricing in a rate hike this fall. The Fed held steady at both Q2 meetings but signaled its next move could be up, not down.
The good news: with oil back near pre-conflict levels, the pressure on inflation should ease in the months ahead. And despite a bumpy spring, stocks shook off the volatility and finished Q2 higher — which says a lot about where investor confidence stands.
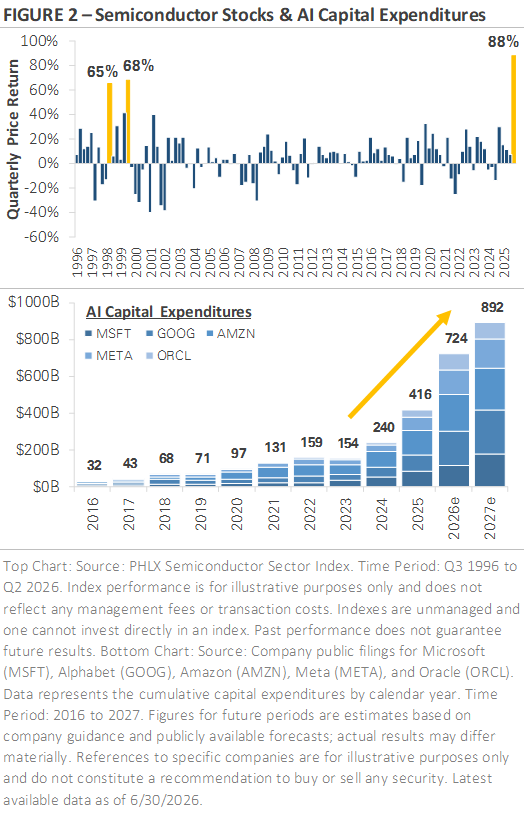
AI Spending Fuels Semiconductor Stock Rally
Semiconductor stocks had their best quarter in nearly 30 years — up 88% for Q2 and briefly touching 100% before a late-June pullback. The last time anything comparable happened was the late 1990s internet boom.
The fuel behind it? A massive wave of AI investment. The five biggest tech companies building AI infrastructure — Microsoft, Amazon, Meta, Alphabet, and Oracle — spent a combined $32 billion in 2016. By 2025 that number hit $416 billion. This year they’re projected to spend $724 billion, and nearly $900 billion next year. That money flows into data centers, chips, and the power to run it all. The companies leading the buildout are posting record earnings and say their only real limit right now is how fast they can build.
AI Is Reshaping Financial Markets Too
The AI boom isn’t just moving stock prices — it’s reshaping how companies raise money. SpaceX completed the largest IPO in history during Q2, raising $85 billion. OpenAI and Anthropic are expected to go public within the year. Meanwhile, public companies like Alphabet and Oracle are issuing stock and bonds to fund their AI buildouts. The sheer scale of capital being raised signals this expansion is still in full swing.
To put it plainly: the market is treating AI as a generational technological shift — and the spending, earnings growth, and forward projections back that up. The closest historical comparison is the late 1990s internet boom, which is worth keeping in mind. That era created real, lasting transformation — and it also came with sky-high expectations baked into prices. Both things were true then. Both things may be true now.
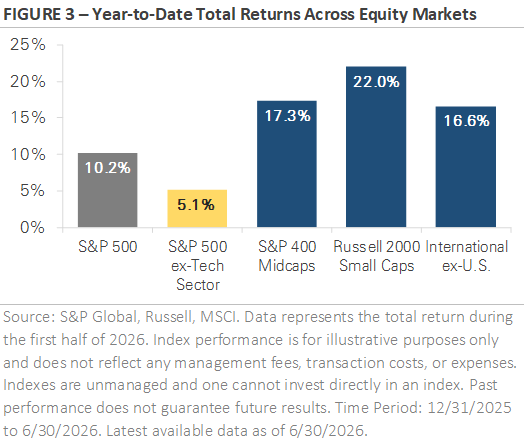
The Rally Isn’t Just a Tech Story
One of the most encouraging signs from Q2 is how wide the gains have spread. The S&P 500 is up 10.2% this year — but remove tech and that drops to 5.1%, showing how much one sector has carried the index. The rest of the market, however, is holding its own. Mid-cap stocks and international markets are both up around 17%, while small-cap stocks have gained 22% — outpacing the S&P 500 entirely.
For years, market gains were driven almost entirely by a handful of mega-cap tech names. That’s changing. Broader participation across company sizes and sectors points to a healthier, more balanced market — and that’s good news for diversified investors.
Why Smaller Companies Are Finally Having Their Moment
Three things explain why smaller stocks are catching up to tech. First, profitability — smaller companies carry more floating-rate debt, so when the Fed cut rates, their costs dropped and margins improved. Second, the economy — smaller, domestically focused companies benefit directly from economic resilience, and despite this year’s oil shock, the economy has held up far better than past energy crises. Third, valuation — after years of tech dominance, smaller companies simply look cheaper, and improving earnings are making that discount harder to ignore.
No single factor tells the whole story, but together they make a compelling case. The broader takeaway: holding a mix of company sizes, styles, and geographies means you’re never entirely dependent on one part of the market to carry your returns.
Q2 Market Recap — By the Numbers
It was a strong quarter across the board. The S&P 500 gained 15.2% — its best quarter since the early pandemic recovery in 2020 — while the Nasdaq surged 27.7% on the back of tech, and the Dow rose 13.4%. Smaller companies kept pace, with the Russell 2000 gaining 21.5%.
Nine of eleven S&P sectors finished positive. Technology led with a 31.8% gain. Industrials, Consumer Discretionary, and Financials each rose 9% or more. Defensive sectors like Utilities and Consumer Staples were flat. Energy was the only loser, falling 13.4% as oil prices retreated.
Internationally, emerging markets gained 24.1% — led by South Korea and Taiwan riding the semiconductor wave — while developed markets rose 11.1%, held back by lighter tech exposure.
Bond Market Recap — Volatile but Resilient
Bonds had a bumpy quarter, with interest rates closely tracking oil prices. Yields rose early as inflation concerns mounted, then pulled back in June as energy prices fell. The 30-year Treasury briefly hit its highest level since 2007 before settling down.
By quarter’s end, the volatility had faded. The broad U.S. bond index returned 0.7% for Q2. Corporate bonds did better — high-yield gained 2.4% and investment-grade returned 1.8%. Credit spreads, which measure how much extra yield corporate bonds offer over government bonds, tightened back after a spring widening. Overall they remain historically tight — a sign of market confidence. The one soft spot: the lowest-rated high-yield bonds haven’t fully recovered, suggesting some caution toward the weakest borrowers.
Looking Ahead — Three Things to Watch in Q3
Stocks finished Q2 near all-time highs despite navigating a war, an oil shock, a three-year inflation high, and Fed rate hike signals. That resilience matters. Here’s what will shape the rest of the year:
Inflation and interest rates. With oil back near pre-conflict levels, inflation is expected to ease. If the upcoming reports confirm that, pressure on the Fed lifts. If inflation stays elevated, a rate hike remains on the table.
The AI buildout. Spending is enormous and stock gains have been historic — but expectations are now very high. Over time, that investment needs to translate into real profits, especially as more of it is being funded by new debt and stock issuance. The late-quarter tech pullback was a reminder of how quickly sentiment can shift.
Market breadth. This year has been unusual — broad participation across sectors and company sizes, while a small group of tech stocks still drives the biggest share of returns. The question is whether gains keep spreading or leadership narrows again.
Open questions can feel unsettling, but context helps. The market faced serious headwinds this quarter and still reached new highs. A diversified portfolio and long-term perspective remain the most reliable tools for navigating whatever comes next.
Let’s Talk About What This Means for You
Headlines move the markets day to day, but your plan is built for the years ahead. If the recent swings have you wondering how your portfolio is positioned — or if something in your life has changed — we’d welcome the conversation. Schedule a time with our team by clicking the button below.
Important Disclosures
This commentary is provided for informational and educational purposes only and should not be considered personalized investment, tax, or legal advice. The views expressed are based on current market conditions and are subject to change without notice.
Any forward-looking statements reflect expectations as of the date of this publication and involve risks and uncertainties. Actual results may differ materially due to changes in market conditions, economic factors, interest rates, inflation, government policy, or other unforeseen events.
Past performance is not indicative of future results. Market returns can vary significantly from year to year, and investing involves risk, including the potential loss of principal. No investment strategy can guarantee a profit or protect against loss in all market environments.
References to specific asset classes, sectors, or investment themes are for illustrative purposes only and do not constitute a recommendation to buy or sell any security. Diversification does not ensure a profit or protect against losses during market declines.
Interest rate changes, inflation trends, and economic conditions can affect both equity and fixed-income investments. Bond values may fluctuate as interest rates change, and corporate bonds carry credit risk related to the financial health of the issuing company.
This material should not be relied upon as a sole basis for making investment decisions. Investors should consider their individual goals, risk tolerance, and financial circumstances and consult with their financial advisor before making any investment decisions.